Table of Contents
- Overview
- Dynamic Luminance Detection
- Variable Patch Targets
- Special Averaging Support
- Measurement Smoothing
- Falses Correction
- Start Points
- Channel Curve Smoothing Tutorial
- Variable Ink Limiting
- Target Luminance Calibration
- Contrast Tweaking
- Channel Remapping
- Curve Blending
- Curve Inversion
- Save a Copy
- Physical Ink Mixing and Blending
- Repurposing Clogged Printers
- Ink Placement Charts
- Initial Fill Instructions
- 1400/1430/1500 Instructions
- P400/R1900/R2000 Instructions
- R3000/P600 Instructions
- 3800/3880/P800 Instructions
- 4000 Instructions
- 4800/4880 Instructions
- 4900 Instructions
- 7600/9600 Instructions
- 7800/9800 7880/9880 Instructions
- 7890/9890 Instructions
- 7900/9900 Instructions
- P6000/P8000 Instructions
- P7000/P9000 Instructions
Piezography Manual
Linearizing Piezography
Overview
Requirements
-
You must have a spectrophotometer (i1Pro, i1Pro2, DTP70, ColorMunki, Spyder, etc *i1Studio does not work).
-
You must be capable of using said spectro and the software that runs it (ColorPort, i1Profiler, ColorPicker, SpyderPrint, etc). We won’t teach you how to use every spectro and software combo but there is a lot of support in the forums.
-
You will need to print a target, let it dry overnight, measure the target, change some numbers around, linearize a .quad, then print a validation print to make sure you are happy. It’s not a quick process but is very straight-forward when you’ve done it a few times.
- You must be capable of using said spectro and the software that runs it (ColorPort, i1Profiler, ColorPicker, SpyderPrint, etc). We won’t teach you how to use every spectro and software combo but there is a lot of support in the forums.
-
Print-Tool (Print-Tool is absolutely required when printing targets in OS X) and QuadToneRIP installed.
-
A perfectly clean and nozzle-checked printer.
Targets
Included in the Piezography package is a series of step target files. These are specially crafted files with very unique tonal values that enable you to print a “map” that the linearizer software uses to calibrate your “.quad” curve file. The two target files that we officially support for this workflow are the 129 and 256 step targets. There are several other targets that we’ve included however. These targets are there to satisfy users and customers who have different workflows, or just need quick-and-easy calibration on the fly. For example, there is a 100x7 step DTP70 target that will average 7x sets of 100 steps each. This is great when profiling for uncoated and textured papers but it requires the xrite DTP-70 spectrophotometer to work!
The targets live at >Piezography >Images > Piezography_Targets >”YourMeasurementSoftware” >”NumberofPatches”_”YourMeasurementDevice”.
CALIBRATION: i1Pro Spectro & ColorPort Software
Print the Target
-
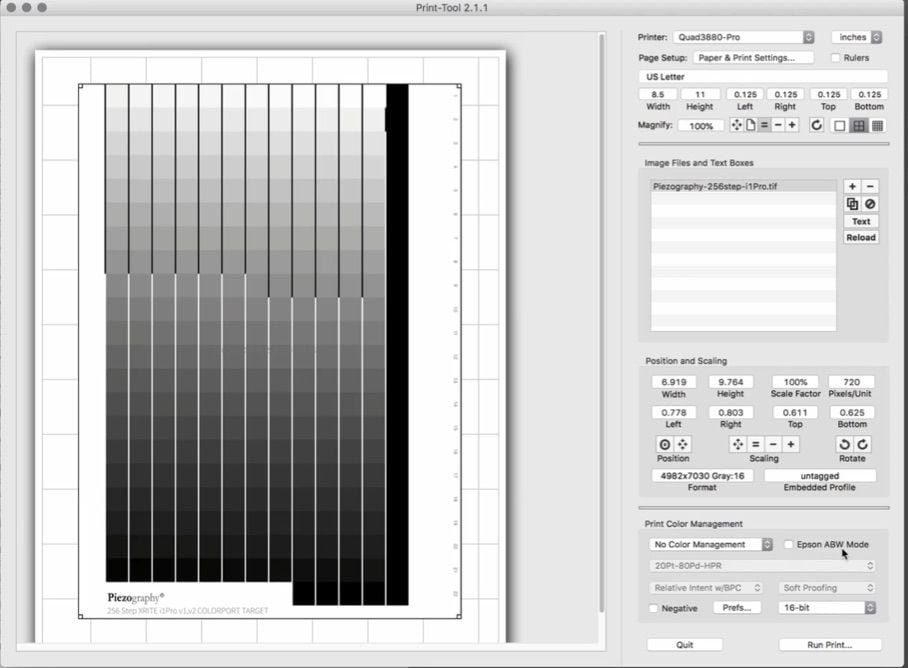
Open Print-Tool (or QTRgui if using PC), then open the correct 256step target “.tif” file. All of the target files are named with how many gray steps they have (256 in this case), and what device/software combination they are built for. For example, there’s a target built with 256 patches for the i1Pro2 device, using the ColorPort workflow, and it’s named: “Piezography-256step-i1Pro.tif” (shown in the Print Tool window), located in the ColorPort folder. Find your correct target. If you are confused by this please read the requirements.
-
Load a letter-size sheet of your desired paper into the printer (rolls work too), then set your page-setup and orientation correctly.
-
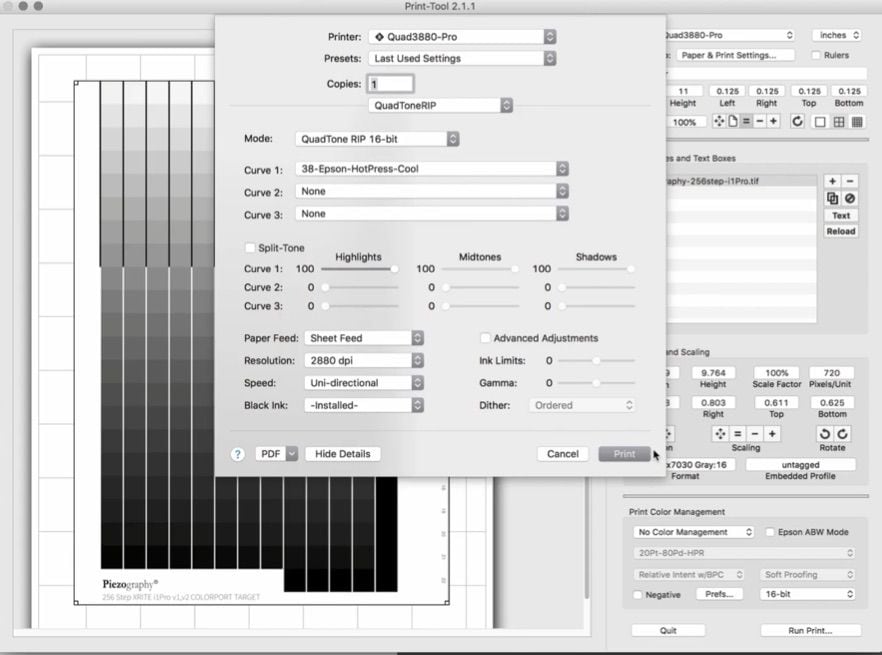
Select No Color Management and 16-bit at the bottom of the Print-Tool window. Push “print” and go to the QuadToneRIP menu item.
-
Select the curve that you want to linearize. The curve should be for a paper that is closest in quality (or equal) to the paper you are wanting to linearize . JonConeType2 is very close to Moab Entrada so this would be a good curve to start with when linearizing Moab Entrada if there isn’t already a Moab curve to work from. Make sure to print at 2880dpi (or 2880dpi super if available) and Uni-Directional to get the best quality!
-
Push “print” to print the target.
-
After the target is printed, hair-dry it for 20 seconds, then let it sit over-night to cure. This is actually a required step that we can’t highlight enough. The ink will change dMax as it dries over a period of 24 to 48 hours.
Measure the Target
-
Once your target has been printed and cured overnight, plug in your i1Pro spectro and open the ColorPort software.
-
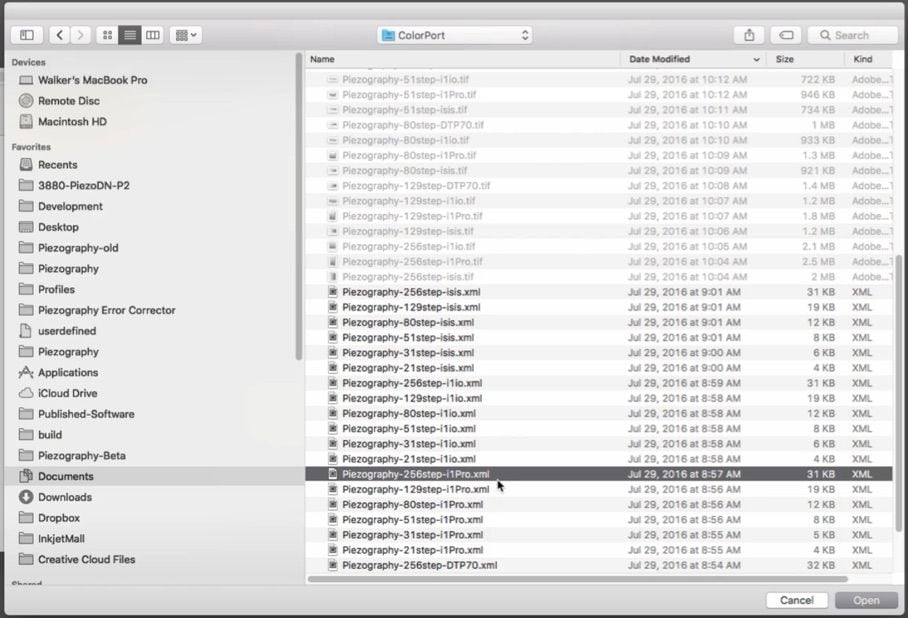
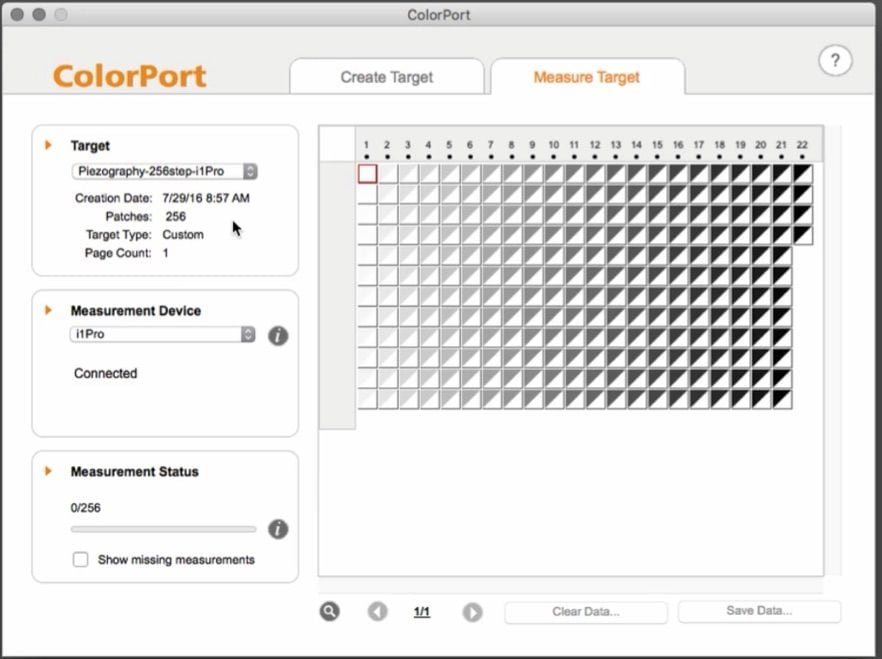
Import the ColorPort “xml” reference files for your printed target. This is done with “Target Manager”. The reference file has the exact same name as your printed target file, with a “.xml” at the end, and is saved in the same folder. If you don’t know how to use Target Manager in ColorPort, read the Xrite documentation. (You will be importing both the 256 step i1Pro xml target file into ColorPort.)
-
Once your device is plugged in, your reference file is selected, and you have white-calibrated your device for “strip” mode, go ahead and measure the target like you would any other target (spot mode takes longer than strip mode, but produces more accurate measurements, and therefore a better curve linearization).
-
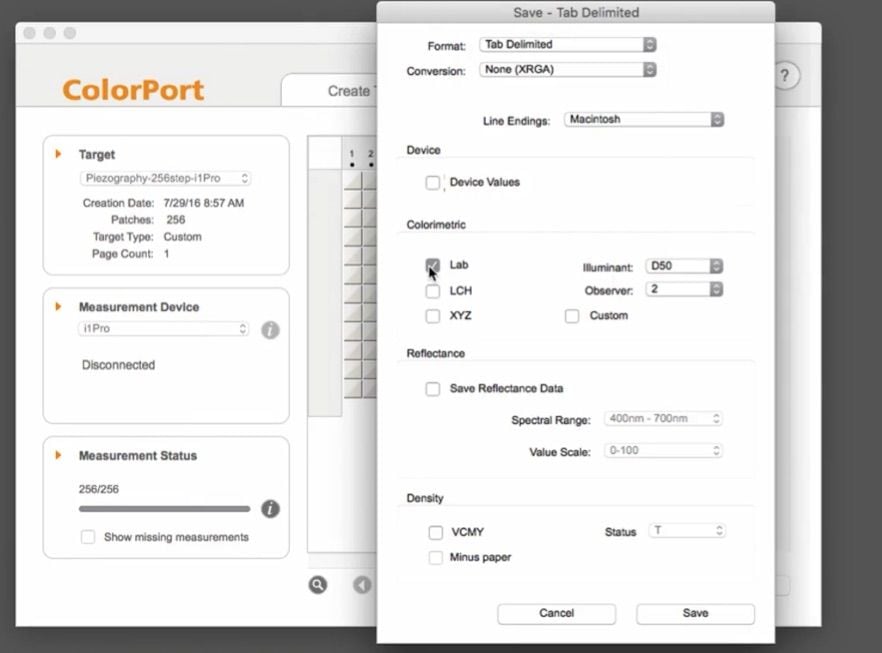
After the target has been measured, click “Save Data”. Select “Tab Delimited” as the data format, and check the “Lab” check box on. Save the file to your desktop. This is a temporary txt file with just the L*a*b* numbers from the measurement.
Correction for Measurement Errors
-
Open the saved measurement .txt file in a text editor. We suggest Sublime Text. (Google for Sublime Text Download). It’s a free and open-source text-editor that works on all operating systems. Unlike Mac TextEdit it actually has a “Save As” menu option. I know, incredible right?
-
Select all and Copy.
-
Open the Piezography-Professional.xlsb from your >Piezography>Tools folder. This tool is the tool that will take both the measurement data and curve data, combine these two pieces, and give you a “New Curve” that is linearized.
-
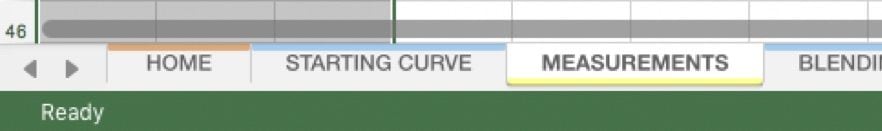
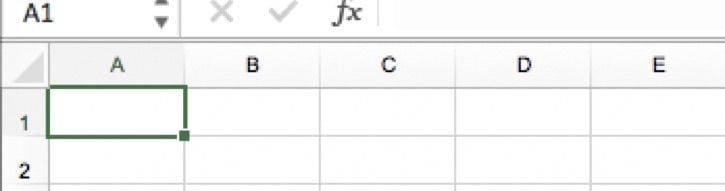
In Excel (Piezography Professional tool) go to the "MEASUREMENTS" sheet. Select all and Right-Click "Clear Contents". Then click A1 once.
-
Go Edit>Paste to paste the measurement data. The data will start in A1 and that first number will be the first LAB_L #.
-
No go to the actual curve that you used when you printed the target. This curve is in your curves folder. On Mac: Applications>Piezography>Curves>YourPrinter. On PC: C:\ProgramFiles\QuadToneRIP\QuadTone(Your Printer Model). Find the .quad curve file, right click, and open this curve file in Sublime Text.
-
Select all and Copy.
-
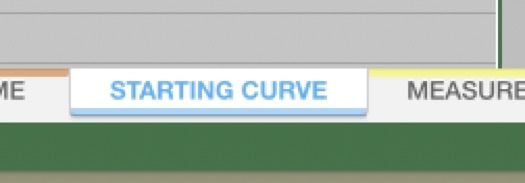
Go to the Piezography Professional Tool. Then go to "Starting Curve" and clear contents on all of A column (right click, clear contents). Click A1 once.
-
Edit>Paste. This will put the starting curve into the A1 column. Now click on the HOME sheet to go back home.

-
Under Smoothing, set both options to 0.
-
Now choose the smooth amount and smooth boost that give a good measurment that is just slightly wavy
-
Now look at the falses column. The Fales column indicates a measured reversal in tone from data in the "measurements" sheet. This goes from light to dark as you scroll down. The most important Luminance values to correct are the top few and the bottom few so make sure these numbers are correct (orange input column) by simply typing in roughly the correct number. All the numbers should be descending in value so the top number (J5) should the highest value and vis versa for the last number.
-
Go to "NEW CURVE" and then Edit>Copy.

-
Go back to Sublime Text where you already have the starting .quad curve open with all the text selected.
Now simply go Edit>Paste to paste over the selected text with the New linearized curve. -
Go File>Save-As and save this new .quad file with the date eg: somename-181225.quad. Save to the same curve folder.
-
If you are on a PC you can use this curve right away. If on a Mac simply double click the installer.command you see in the curve folder and this will install the new curve and make it show up in the QuadtoneRIP driver ready for use!
Measuring with i1Profiler (instead of ColorPort)
-
Once your target has been printed and cured overnight, plug in your i1Pro spectro and open the i1Profiler software.
-
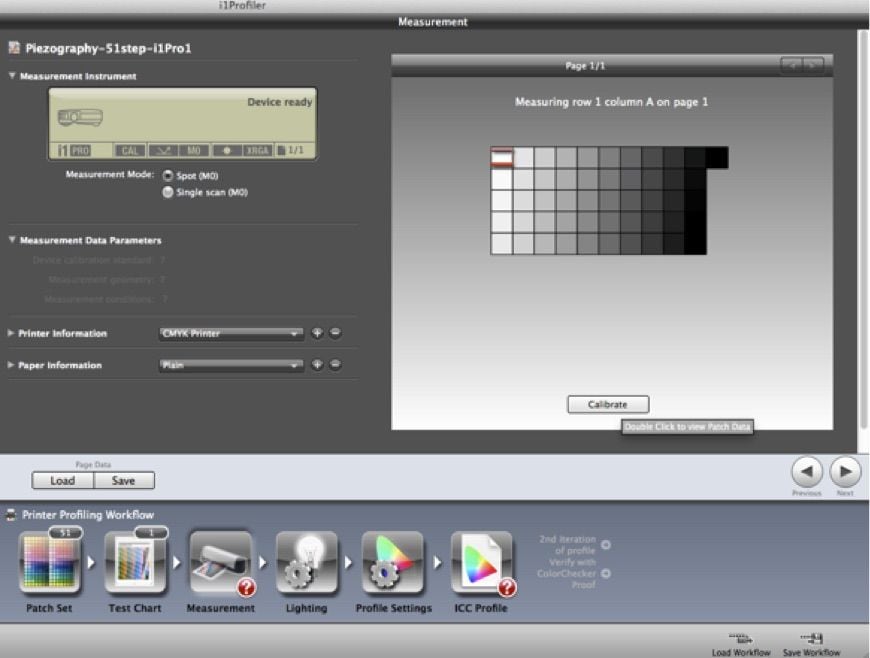
Import the target reference files by clicking “Load Workflow” on the bottom/right corner. The reference file has the exact same name as your printed target file, with “.pwxf” at the end, and is saved in the same folder. If you don’t know how to use “Load Workflow” in i1Profiler, read the Xrite documentation. The screenshot is with the 51 step target (old workflow). But just import the 256 i1Profiler workflow as you follow along.
-
Once your device is plugged in, your reference file is selected, and you have white-calibrated your device for strip mode, go ahead and measure the target like you would any other target.
-
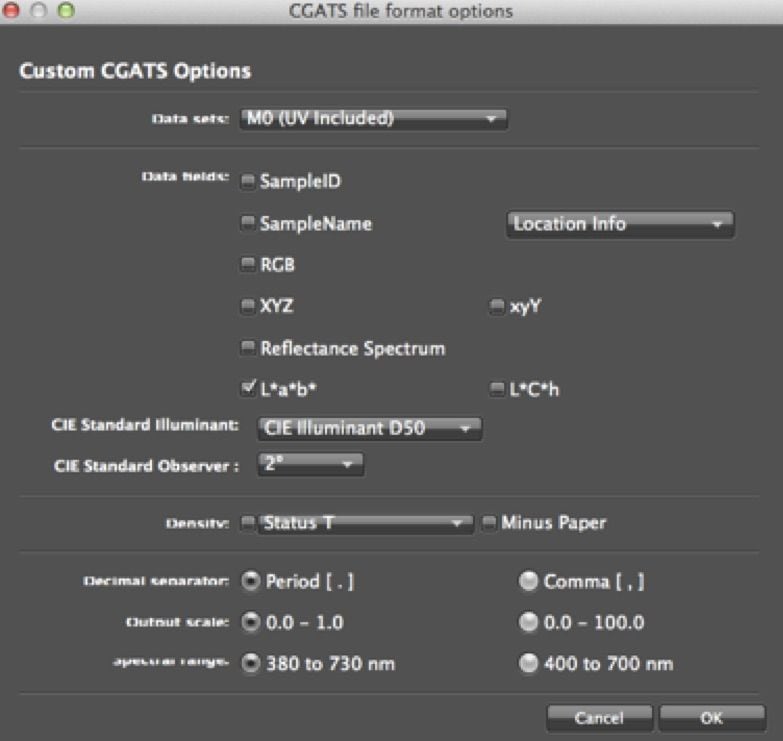
After the target has been measured, click “Save”. Select “M0 (UV Included)” as the data sets, then check the “L*a*b*” check box, and uncheck all other boxes. Save the file to your desktop. This is a temporary txt file with just the L*a*b* numbers from the measurement.
-
Open up this .txt file but instead of opening it inside of SublimeText, drag it over Excel. This will allow you to copy ONLY the LAB numbers under the LAB_L, LAB_A, and LAB_B column headers.
-
Paste these numbers in a new txt file, then select this txt and paste into the measurements sheet of the Piezography Professional XLSB tool just as written in the first section of this chapter (colorport). From this point on it’s the same workflow as the first section so continue there.
Measuring with ColorMunki Spectro & ColorPicker Software
-
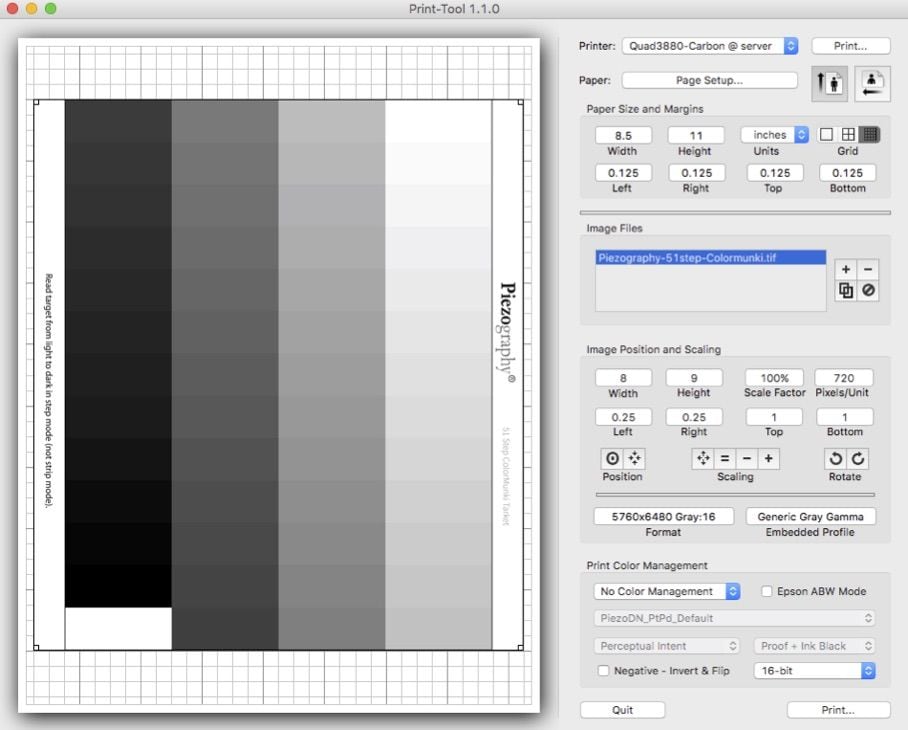
Open Print-Tool (or QTRgui if using PC), then open the correct 51step target “.tif” file. All of the target files are named with how many gray steps they have (51 or 129 step in this case), and what device/software combination they are built for. For example, there’s a target built with 51 (and 129) patches for the ColorMunki device, using the ColorPicker software, and it’s named: “Piezography-51step-Colormunki.tif” (shown in the Print Tool window, below), located in the ColorMunki folder. Find your correct target. If you are confused by this please read the requirements listed above.
-
Load a letter-size sheet of your desired paper into the printer (rolls work too), then set your page-setup and orientation correctly.
-
Select No Color Management and 16-bit at the bottom of the Print-Tool window. Push “print” and go to the QuadToneRIP menu item.
-
Select the curve that you want to linearize. Make sure to print at 2880dpi and Uni-Directional to get the best quality!
-
Push “print” to print the target.
-
After the target is printed, hair-dry it for 20 seconds, then let it sit over-night to cure. This is actually a required step that we can’t highlight enough. The ink will change dMax as it dries over a period of 24 to 48 hours.
Read the Target
-
Once your target has been printed and cured overnight, plug in your ColorMunki spectro and open the ColorPicker software. *Note: For Mac El Capitan 10.11, you will need to download and install a patch for ColorPicker to work. Google it.

-
Calibrate your ColorMunki to prepare it for measuring.
-
Once your ColorMunki is plugged in and you have white-calibrated the device for “spot” mode, go ahead and measure the target like you would any other target, making sure to center on each patch before pushing the measure button.
-
After the target has been measured, go to File> Export. Select “Comma Separated” format, and save the file to your desktop. This is a temporary .csv file with the L*a*b* numbers from the measurement.

Correct for Measurement Errors
-
Open up this .txt file but instead of opening it inside of SublimeText, drag it over Excel or open in Google Sheets (screenshot on right). This will allow you to copy ONLY the LAB numbers under the LAB_L, LAB_A, and LAB_B column headers.
-
Paste these numbers in a new txt file, then select this txt and paste into the measurements sheet of the Piezography Professional XLSB tool just as written in the first section of this chapter (colorport). From this point on it’s the same workflow as the first section so continue there.
Workflow Consideration
Piezography is a very high-quality system for printing, but every system is only as good as its weakest link. In the case of linearization, one’s ability to properly measure the targets is often the weakest link. This is primarily an issue when using “strip” reading with a spectrophotometer. If the practitioner reads too slow, too fast, or in a jerky fashion, measurement errors will abound. The 51 and 129 step tools available in the Piezography Professional Edition help correct for minor measurement errors that are a part of all but the most expensive measurement devices, but they do not correct for user error. If the target patches are too small for perfect manual step reading, targets found in the ColorMunki and Spyder folders will work perfectly, as these two devices require step-by-step measurements.
Another thing to be aware of is how QuadToneRIP handles and installs curves. On the PC, simply placing a new curve in its corresponding folder inside the QuadToneRIP folder will install the curve. It’s very easy to delete and replace curves. On the Mac, everything is a bit more difficult. When a curve is linearized, you save it to your curve folder and install it by double-clicking the “Install.command” found in the curve folder. The new curve will be installed deep into the system (Library/Printers/QTR/Quadtone/Printer Model-K7/thenewcurve.quad). The problem is if you delete a .quad you don’t need from the local Curve folder (Applications/Piezography/Curves/Some-Printer-Folder), then re-install the printer, the old curve will not be deleted from the QTR curve list. To actually delete old curves and keep the curve list tidy, you must go to the corresponding curve folder in /Library/Printers/...... and delete it. Then you must delete the old curve in the local user folder, as well as the Quad-printer from the printer list in System Preferences. Then when you run the Install.command, only the curves found in the local folder will be installed. We suggest simply putting the date on each new curve file name or deleting the old curve and naming the new curve the same so it’s replaced when the Install.command is clicked.
Permissions Check
Please be aware now that OS X in the Monterey (v13) forward era has intense permissions issues. Each subsequent OS X release increases permissions issues. Piezography curves (.quad files) are in the Library of OS X an area Apple rigorously defends against virus and malware to the point of making it difficult for a User (such as you) and an "everyone" user such as QuadTone RIP to access .quad files. In the Installation of QuadTone RIP section of this documentation we outline a way to use Terminal to open permissions prior to installation. On some OS X versions, the line of Unix code "sudo chmod -R 777 /Library/Printers/QTR/quadtone" entered into Terminal can open permissions to "everyone" to Read & Write. Sometimes it cannot post installation and must be done prior. You can verify that the installation of your newly created curves are accessible to QuadTone RIP by navigating to /Library / Printers / QTR / quadtone / the name of the folder for your installation... look for your new curve. Select the new curve and Get Info from the File menu or right click if you have it. Check the permissions tab for "everyone" is Read & Write. If it is not, your output may be nearly all black. You can edit permission to Read & Write.